Most data scientists wished that all data lived neatly managed in some DB. However, in reality, Excel files are ubiquitous and often a common way to disseminate results or data within many companies. Every now and then I found myself in the situation where I wanted to protect Excel sheets against users accidentally changing them. A few months later, however, I found that I sometimes had forgotten the password I used. The “good” thing is that protecting Excel sheets by password is far from safe and access can be recovered quite easily. The following works for .xlsx files only (tested with Excel 2016 files), not the older .xls files.
Before implementing the steps in R, I will outline how to remove the password protection “by hand”. The R way is simply the automation of these steps. The first thing one needs to understand is that a .xlsx file is just a collection of folders and files in a zip container. If you unzip a .xlsx file (e.g. using 7-Zip) you get the following folder structure (sorry, German UI): Continue reading ‘Remove password protection from Excel sheets using R’
Filed under: R / R-Code | 8 Comments
Data frames are lists
Most R users will know that data frames are lists. You can easily verify that a data frame is a list by typing
d <- data.frame(id=1:2, name=c("Jon", "Mark"))
d
 id name
1 1 Jon
2 2 Mark
is.list(d)
[1] TRUE
However, data frames are lists with some special properties. For example, all entries in the list must have the same length (here 2), etc. You can find a nice description of the differences between lists and data frames here. To access the first column of d, we find that it contains a vector (and a factor in case of column name). Note, that [[ ]] is an operator to select a list element. As data frames are lists, they will work here as well. Continue reading ‘Populating data frame cells with more than one value’
Filed under: R / R-Code | 6 Comments
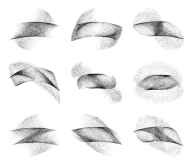
 Today I was working on a two-part procrustes problem and wanted to find out why my minimization algorithm sometimes does not converge properly or renders unexpected results. The loss function to be minimized is
Continue reading ‘Beautiful plots while simulating loss in two-part procrustes problem’
Filed under: R / R-Code | 4 Comments
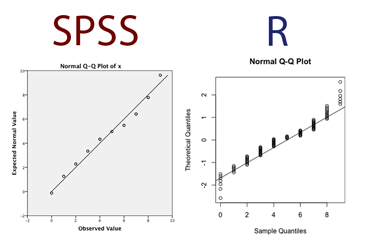
We teach two software packages, R and SPSS, in Quantitative Methods 101 for psychology freshman at Bremen University (Germany). Sometimes confusion arises, when the software packages produce different results. This may be due to specifics in the implemention of a method or, as in most cases, to different default settings. One of these situations occurs when the QQ-plot is introduced. Continue reading ‘QQ-plots in R vs. SPSS – A look at the differences’
Filed under: R / R-Code | Leave a Comment
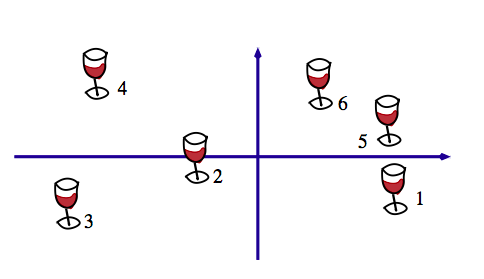
Today I stumbled across a figure in an explanation on multiple factor analysis which contained pictograms.
Figure 1 from Abdi & Valentin (2007), p. 8.
I wanted to reproduce a similar figure in R using pictograms and additionally color them e.g. by group membership . I have almost no knowledge about image processing, so I tried out several methods of how to achieve what I want. The first thing I did was read in an PNG file and look at the data structure. The package png allows to read in PNG files. Note that all of the below may not work on Windows machines, as it does not support semi-transparency (see ?readPNG).
Continue reading ‘Using colorized PNG pictograms in R base plots’
Filed under: R / R-Code | 2 Comments
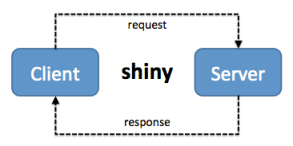
 After some time of using shiny I got to the point where I needed to send some arbitrary data from the client to the server, process it with R and return some other data to the client. As a client/server programming newbie this was a challenge for me as I did not want to dive too deep into the world of web programming. I wanted to get the job done using shiny and preferably as little JS/PHP etc. scripting as possible. Continue reading ‘Sending data from client to server and back using shiny’
Filed under: R / R-Code | 19 Comments
I recently wanted to construe a dashboard widget that contains some text and other elements using the grid graphics system. The size available for the widget will vary. When the sizes for the elements of the grobs in the widget are specified as Normalised Parent Coordinates the size adjustments happen automatically. Text does not automatically adjust though. The size of the text which is calculated as fontsize times the character expansion factor (cex) remains the same when the viewport size changes. For my widget this would require to adjust the fontsize or cex settings for each case seperately. While this is not really an obstacle, I asked myself how a grob that will adjust its text size automatically when being resized can be construed. Here I jot down my results in the hope that you may find this useful. Continue reading ‘Creating a text grob that automatically adjusts to viewport size’
Filed under: R / R-Code | Leave a Comment
Useful R snippets
 In this post we collect several R one- or few-liners that we consider useful. As our minds tend to forget these little fragments we jot them down here so we will find them again. Continue reading ‘Useful R snippets’
Filed under: R / R-Code | 5 Comments
 Guest post by Daniel Adler.
Below is a real-time audio-visual multimedia demonstration – or in short ‘an intro’ – written in 100% pure R. It requires no compilation and runs across major platforms via the package rdyncall and preinstalled precompiled standard libraries such as OpenGL and SDL libraries. This ‘happy-birthday’ production runs about 3 minutes and comprises typical effects of the home computer oldschool demoscene era such as a rotating cube, multi-layer star field, text scrollers, still images and flashes while playing a nice Amiga Soundtracker module tune. Check out the video screen-cast (with sound) or enjoy a smooth framerate using the R version at this website.
Continue reading ‘multi-platform real-time ‘intro’ in R using rdyncall’
Filed under: R / R-Code | 3 Comments
Tags: intro, R
 The first week of April I attended an excellent workshop on biplots held by Michael Greenacre and Oleg Nenadić at the Gesis Institute in Cologne, Germany. Throughout his presentations, Michael used animations to visualize the concepts he was explaining. He also included animations in some of his papers. This inspired me to do this post in which I will show how to use LaTex, R and Sweave to include animations in a PDF document. Here is the PDF document we will create (on MacOS the standard PDF viewer may not be able to play the animations, but Adobe Reader will). For this post some basic knowledge about Sweave is assumed. Continue reading ‘Using R, Sweave and Latex to integrate animations into PDFs’
Filed under: R / R-Code | 7 Comments


 All postings

